The topic of today is about Venn diagrams, see here for a detailed defition. I will quickly show you how to draw a Venn diagram composed of three distinct datasets in R.
For this purpose you will need the VennDiagram package. Start R and install the required package as follow:
install.packages('VennDiagram')
library(VennDiagram)
The main command to draw your Venn diagram is:
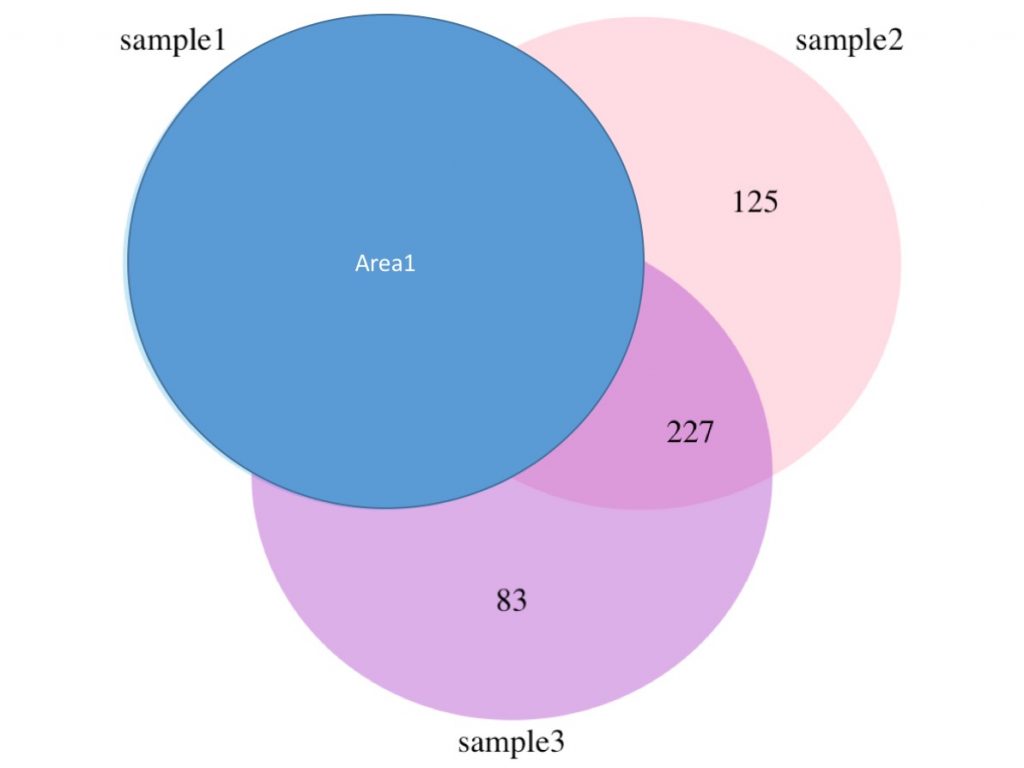
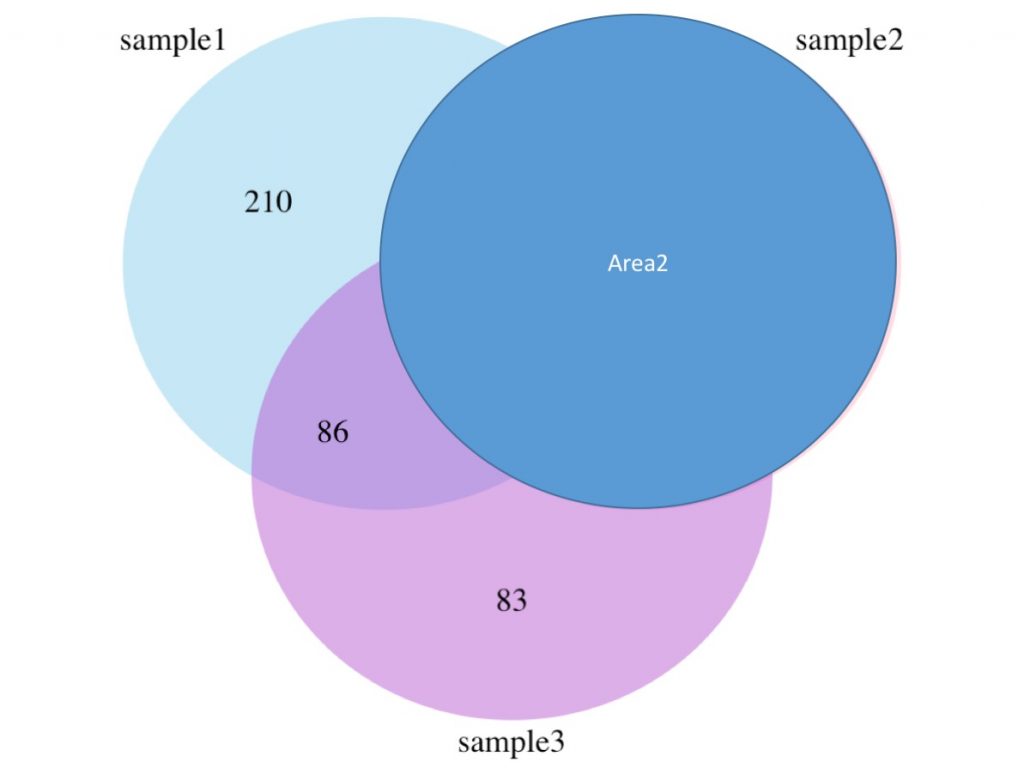
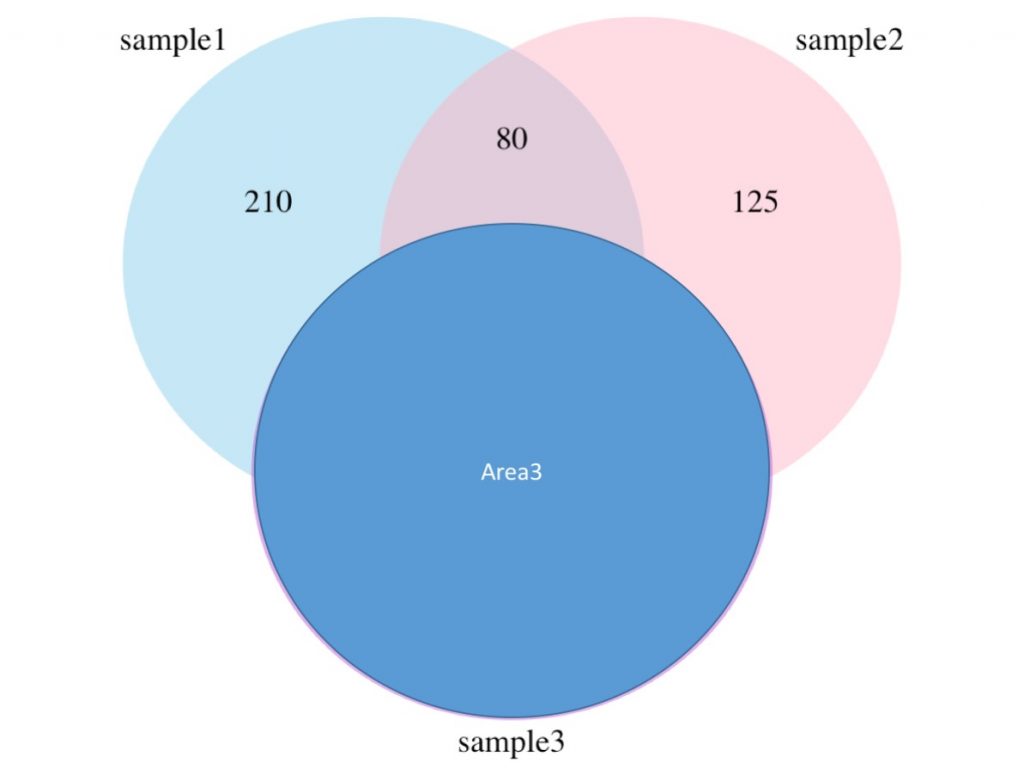
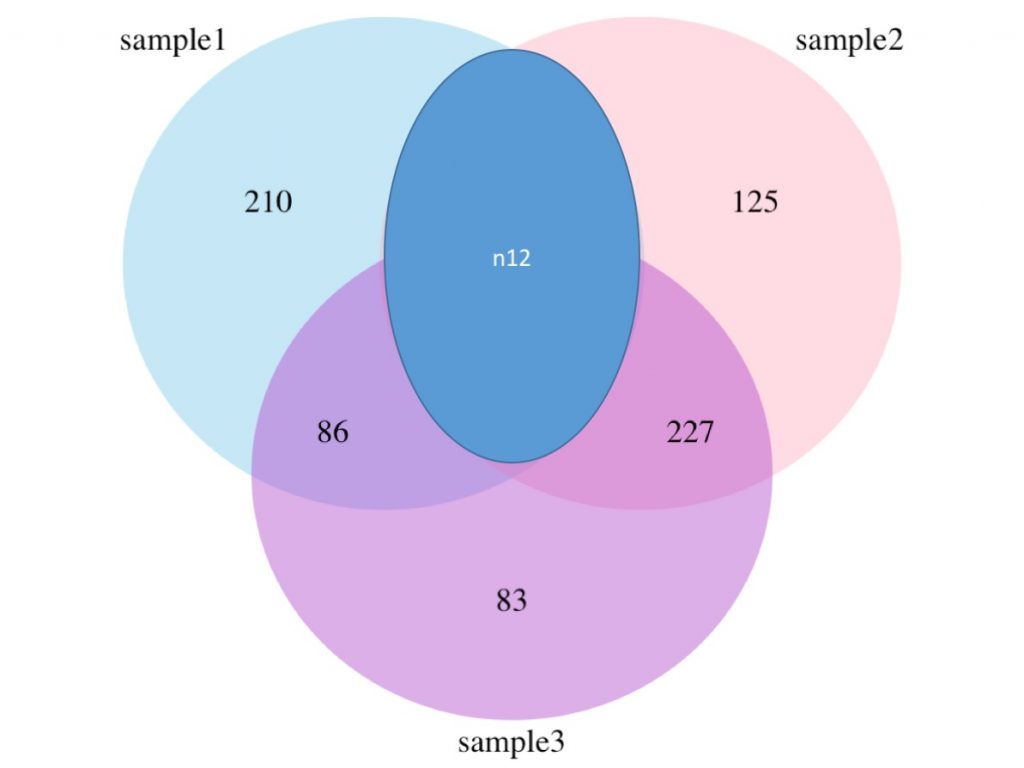
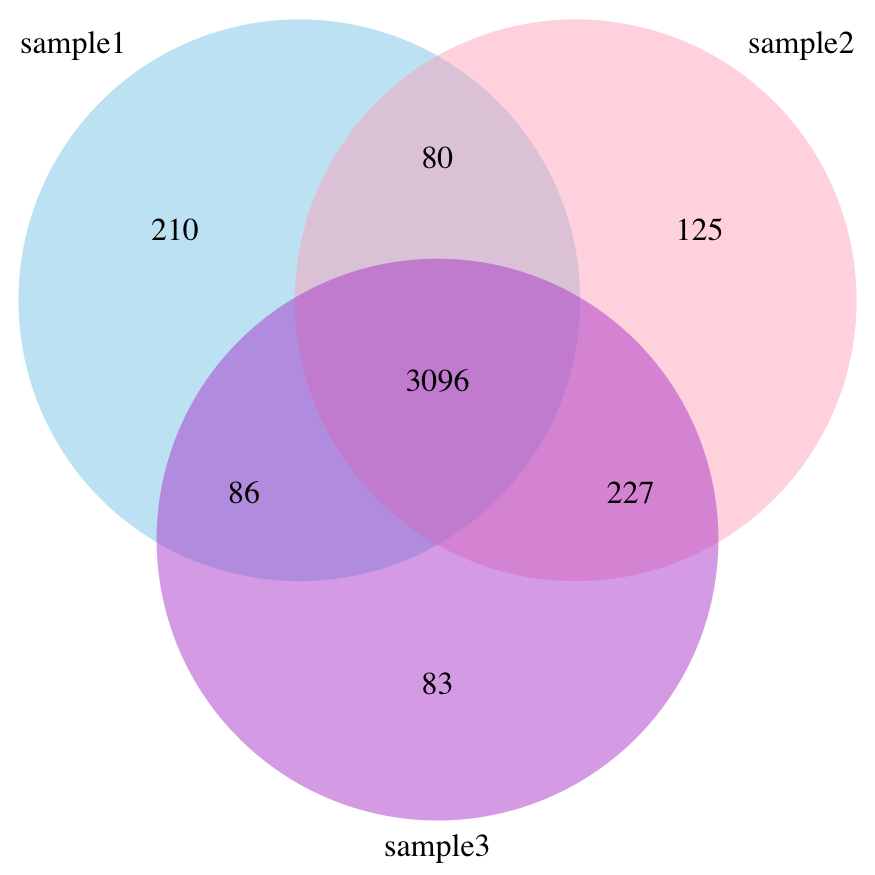
draw.triple.venn(area1 = 3472, area2 = 3528, area3 = 3492, n12 = 3176, n23 = 3323, n13 = 3182, n123 = 3096, category = c("sample1", "sample2", "sample3"), lty = "blank", fill = c("skyblue", "pink1", "mediumorchid") , cex=2, cat.cex=2, cat.fontfamily = rep("serif", 3))
The resulting Venn diagram will look like :
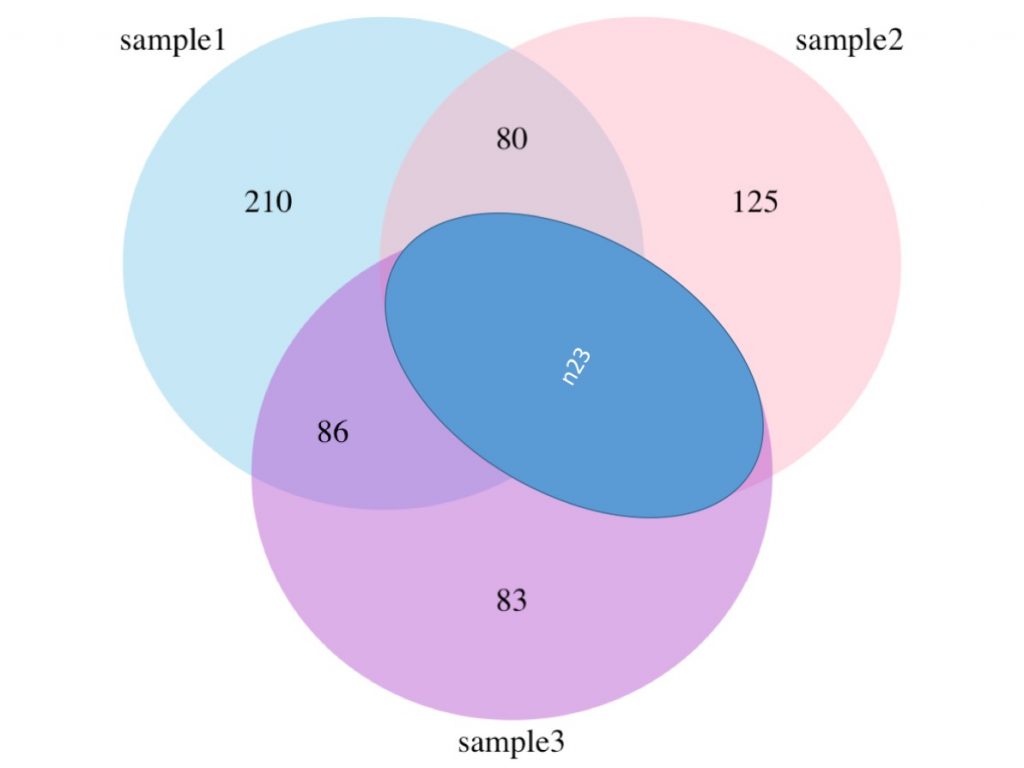
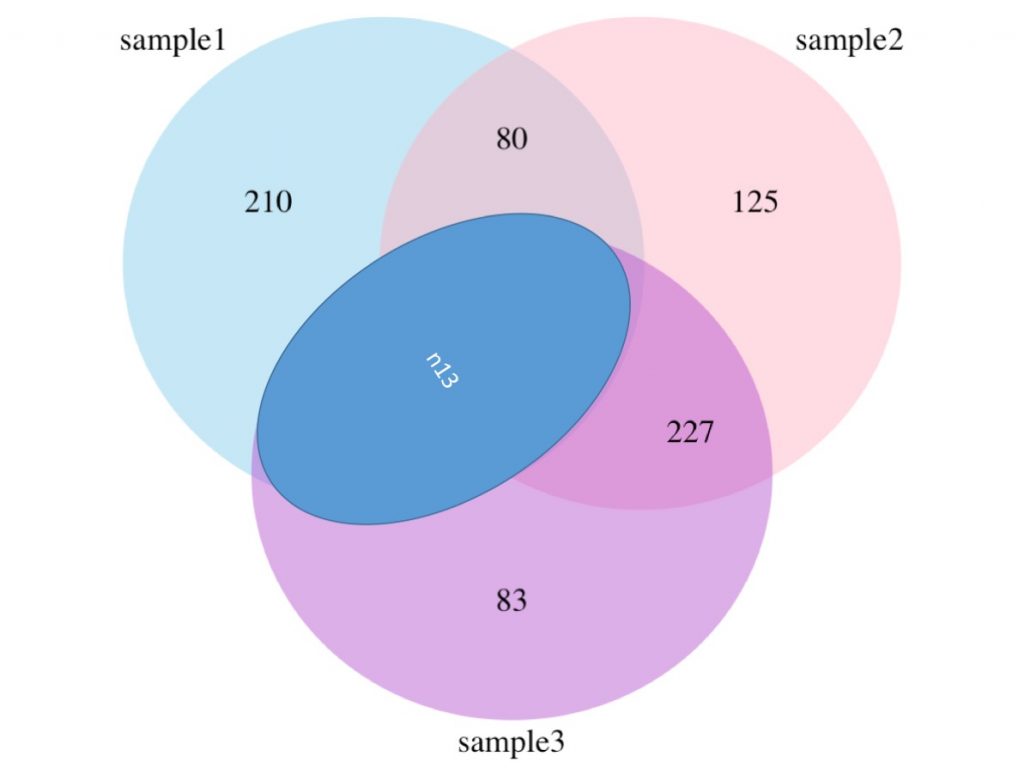
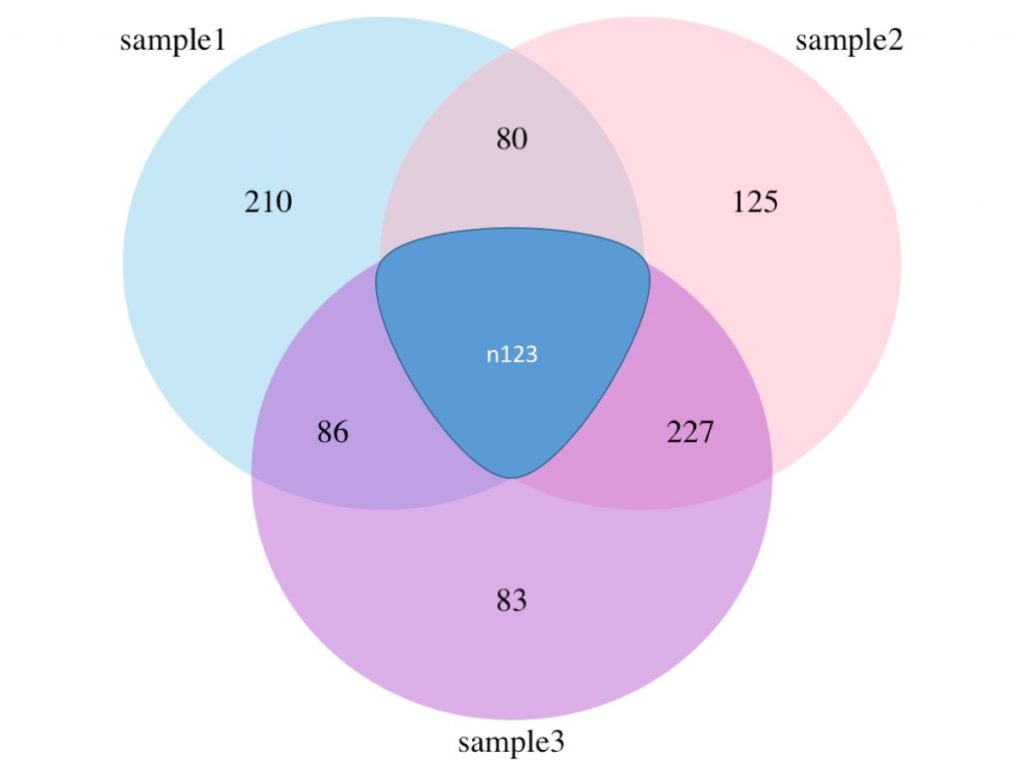
The explanation of the different numbers (area1, area2, area3, n12, n23, n13 and n123) are represented in the figures below: